Understanding the Nakamoto Coefficient: A Structural Lens on Onchain Risk

In crypto, many metrics are discussed casually: TVL, liquidity, volume, active users.
They are useful but they rarely tell us who actually controls a system, or how it behaves under stress.
At Bitpulse, we focus on structural risk: how systems fail, how control concentrates, and how difficult it is to coordinate adverse outcomes.
One of the clearest quantitative lenses for this is the Nakamoto Coefficient metric.
When interpreted correctly, the Nakamoto Coefficient provides insight into a network’s true resilience and materially improves how risk is priced, capital is allocated, and exposure is sized across blockchain ecosystems.
What Is the Nakamoto Coefficient metric?
At its core, the Nakamoto Coefficient represents:
The minimum number of distinct entities required to control more than 50% of a given resource.
In simple terms, it answers the question:
“How many parties need to join to break something?”
Originally proposed by Balaji Srinivasan and Leland Lee, and named after Satoshi Nakamoto, the metric was designed to quantify decentralization in a practical, quantitative sense – not philosophical ones!
For example: In terms of number of Nodes, Polkadot is the most decentralized chain right now.
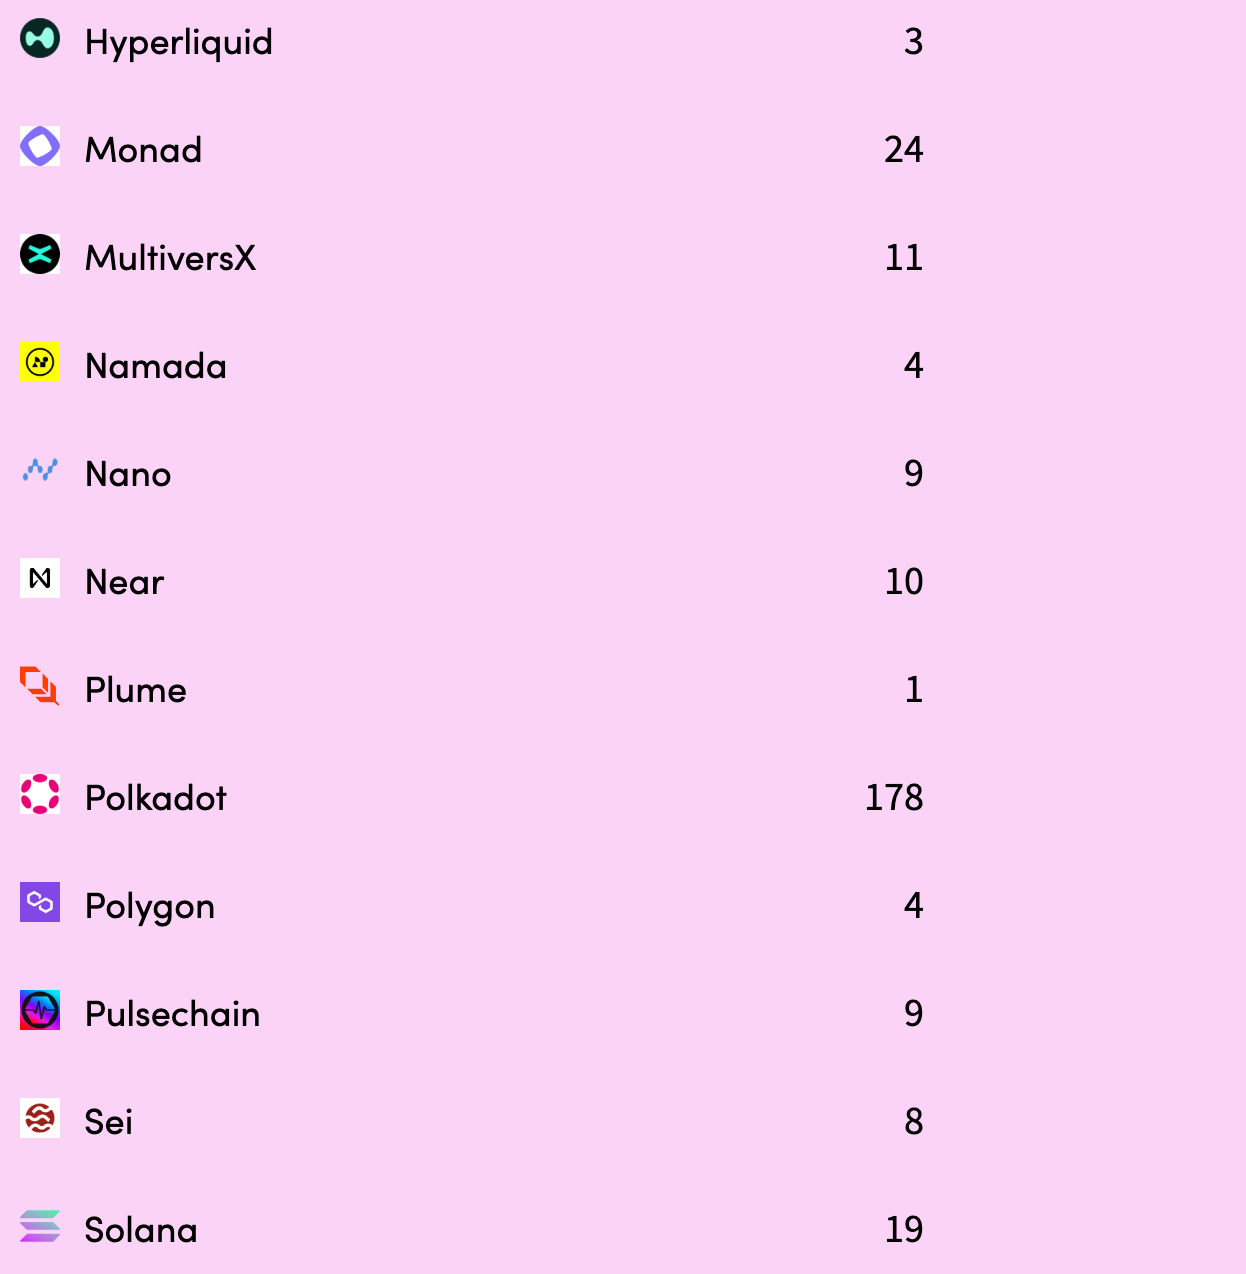
Source: Nakaflow
Where is the Nakamoto Coefficient metric useful?
1. Liquidity Risk in DEXs and Pools
Liquidity matters, but who supplies that liquidity matters as well.
Consider two scenarios:
Scenario A
- Pool has $100M liquidity.
- 10 providers each hold 10%.
- Nakamoto Coefficient = 6 (need six to breach 50%).
Scenario B
- Pool has $100M liquidity.
- 1 provider holds 45%, next two hold 5% each.
- Nakamoto Coefficient = 3.
Even though total liquidity is the same, Scenario B is structurally riskier because fewer providers can withdraw a large portion of liquidity shaking.
2. Volume Concentration & Execution Risk
Just like liquidity, trading volume distribution can be concentrated.
If a small set of venues or pools account for the majority of the volume:
- Large orders will impact prices more
- Price slippage is likely to be higher
- Liquidity vacuums appear during stress periods
A low Nakamoto Coefficient for trading volume means a handful of venues dominate trading.
This increases execution risk, especially for larger trades.
3. Governance Power and Control Risk
In decentralized protocols, governance decisions can be dominated by a few token holders.
If only a handful of wallets hold > 50% of voting power:
- Decisions are effectively centralized
- Protocol changes can be pushed through faster without sufficient oversight
- Minority stakeholders have little/negligible influence
4. Predictive Signals for Liquidity Drains
Generally before significant liquidity drains/dumps:
- Liquidity concentration often rises
- A smaller set of entities control a larger share
Tracking changes in the Nakamoto Coefficient over time helps identify emerging concentration trends before they turn into a crisis.
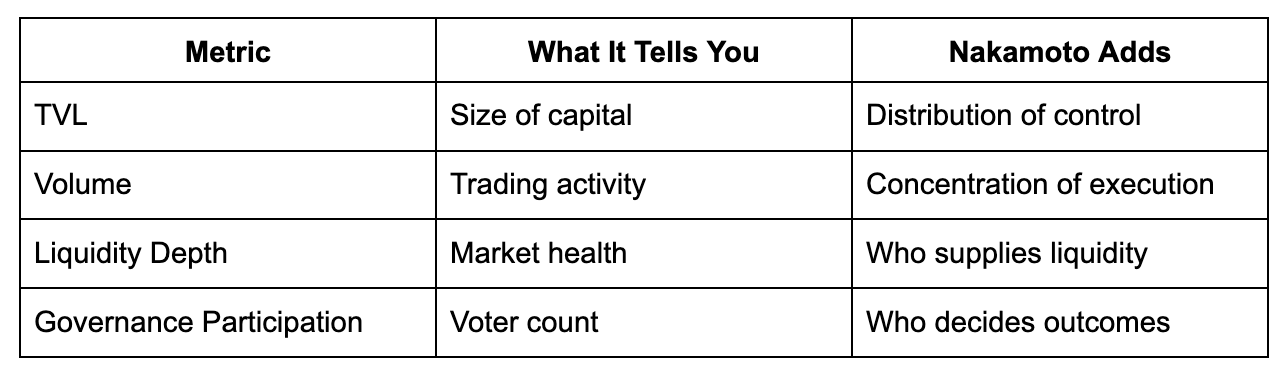
How does the Nakamoto Coefficient work with other metrics?
No single metric tells the entire story, but the Nakamoto Coefficient gives a stability angle when combined with other metrics
Interpreting the Number Correctly
There is no universal “safe” threshold, but as a rule of thumb in current Proof-of-Staking ecosystems:
- 3 - 5: High fragility
- 10 - 20: Moderate resilience
- 30+: Strong decentralization (relative to peers)
Higher is generally better but context always matters. The coefficient should never be interpreted in isolation.
Why does the Nakamoto Coefficient Matters?
It quantifies real decentralization. Decentralization is often claimed based on:
- Number of nodes
- Marketing narratives
- Geographic spread
But none of these matter if a small group can still influence the action.
The Nakamoto Coefficient cuts through noise by focusing on the level of control an entity has
Bitpulse View: What this metric really represents?
At Bitpulse, we view the Nakamoto Coefficient as a measure of coordination difficulty under adversarial conditions.
The Nakamoto Coefficient forces uncomfortable but necessary questions:
- Who really controls the chain?
- How hard is it to stop it?
- What happens under stressful conditions?
As capital, applications, and users move onchain, these questions stop being just theoretical and become existential.
Final Takeaway
The Nakamoto Coefficient is one of the clearest lenses we have into a blockchain’s structural integrity.
- Low coefficient could mean it is easier to break, censor, or capture
- High coefficient could mean it is harder to coordinate attacks
Decentralization is not about how many nodes exist, it is about how many must fail for the system to fail.
Want to see the Nakamoto Coefficient for your protocol or a position in your portfolio? Reach out to info@bitpulse.io and we’ll get you set up.
Get risk insights in your inbox
.webp)